Impacts of Climate Change on Peak Wildflowers
  • MeadoWatch
  • Wiki


Flower Filter


Information


Controller


Time Converter


Flower Gallery

americanbistort

American Bistort

POBI

avalanchelily

Avalanche Lily

ERMO

bractedlousewort

Bracted Lousewort

PEBR

graylovage

Grays Lovage

LIGR

magentapaintbrush

Magenta Paintbrush

CAPA

mountaindaisy

Mountain Daisy

ERPE

northmicroseris

North Microseris

MIAL

sitkavalerian

Sitka Valerian

VASI

subalpinelupine

Subalpine Lupine

LUAR

westernanemone

Western Anemone

ANOC

Previous Next

Site Information

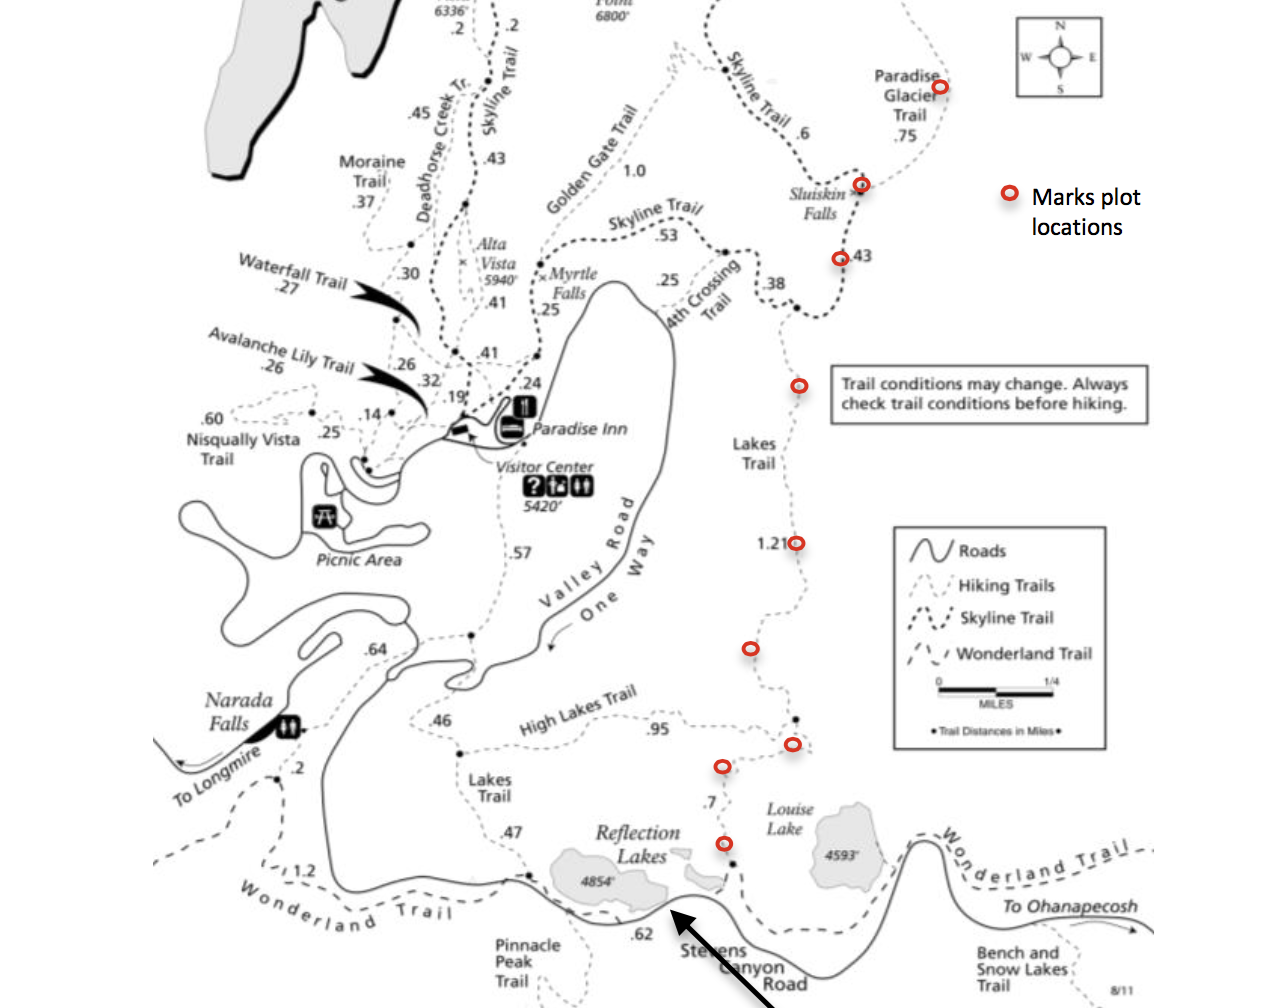
Site 1: 46.771 Latitude, 121.723 Longitude, 1490 m Altitude

Site 2: 46.773 Latitude, 121.723 Longitude, 1540 m Altitude

Site 3: 46.775 Latitude, 121.720 Longitude, 1600 m Altitude

Site 4: 46.778 Latitude, 121.722 Longitude, 1650 m Altitude

Site 5: 46.782 Latitude, 121.720 Longitude, 1680 m Altitude

Site 6: 46.787 Latitude, 121.719 Longitude, 1745 m Altitude

Site 7: 46.792 Latitude, 121.717 Longitude, 1805 m Altitude

Site 8: 46.794 Latitude, 121.716 Longitude, 1840 m Altitude

Site 9: 46.797 Latitude, 121.712 Longitude, 1880 m Altitude

Wiki

The seasonal progression of flowering for ten wildflower species at Mt. Rainier National Park in three years experiencing different climates. Each panel represents a year, with each band in the top panel representing one of the nine plots in which MeadoWatch volunteers documented wildflowers blooming. Different colored dots (top panel) and shades in histograms (bottom panel) represent one of the ten focal species monitored. As time progresses when you hit play, bands turn from light blue to dark green when snow melts from plots, dots turn colored when flowers are observed in plots, and the heights of the bars in the histogram (bottom panel) document the total number of wildflower species observed flowering (i.e. the wildflower season). Note that 2015 in was the earliest snowmelt year on record at Mt. Rainier National Park (analogous to climates expected in 2080), by contrast to 2013 and 2014, which experienced average snow amounts and meltout dates.