Relocating Rembrandt: Visualizing Provenance Records
ABSTRACT
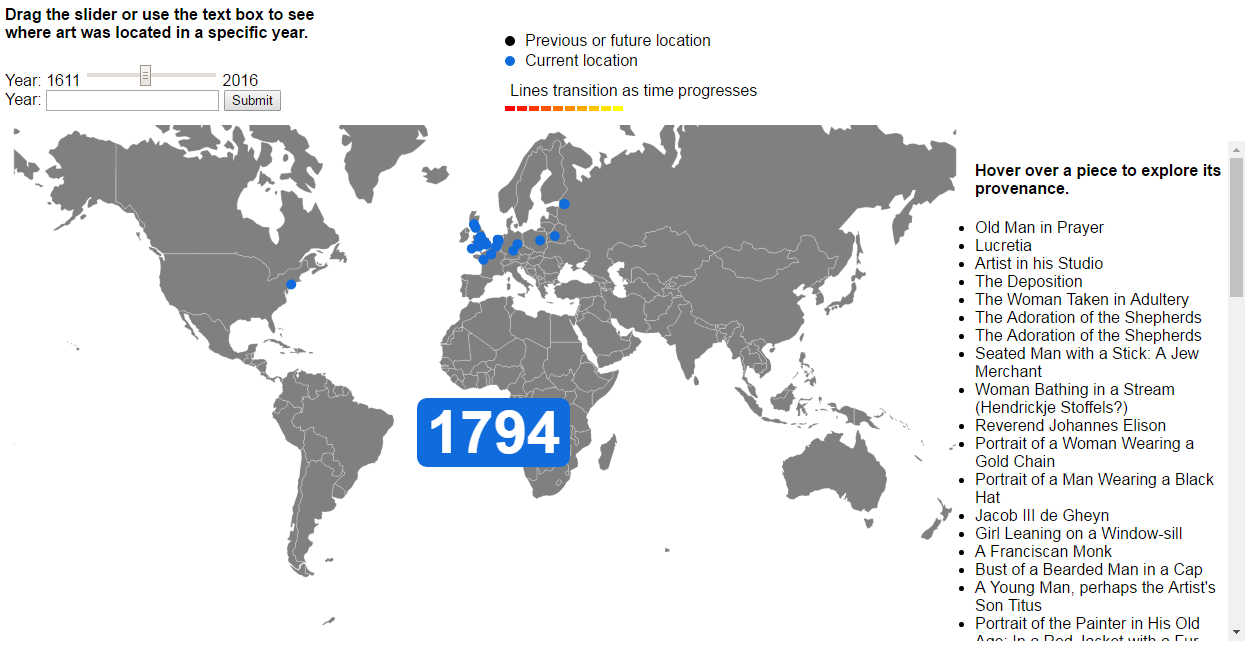
Recent focus on looted art restoration has led to governments, museums, and private organizations publishing the provenance for their collections. Little work has been done to standardize and visualize this data could lead to new engagement with the humanities. This project visualizes provenance records for the artist Rembrandt Harmenszoon van Rijn across the dimensions of time and geography. Additionally, this project establishes a standard format for provenance data intended for such visualizations and highlights the challenges manipulating the available data for visualization. Provenance data is manipulated by hand utilizing Excel tools and R scripts assist when applicable. The data is visualized on a world map highlighting the location of individual pieces of art between 1611 and 2016. When a year and piece are specified, the map shows the geographic path the piece has travelled as time progressed. While the time-cost of data preparation is high, the visualization successfully enables the exploration of the movement of art through time at a macro level and highlight times of major geographic change in art. The visualization also enables comparison between the provenances of individual pieces. This project lays the groundwork for data-processing provenance records and creates visualization for art provenance across time and geography at both a large and small scale and lays out recommendations for improved data-processing and art provenance visualization.
Software
Try it online here.